Adding Elements
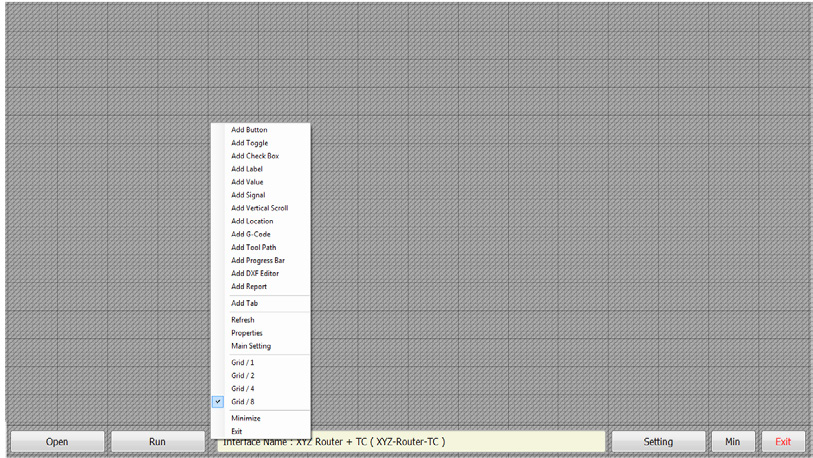
When you right-click on an empty area in the interface editing environment, the window shown in Figure 27 appears.
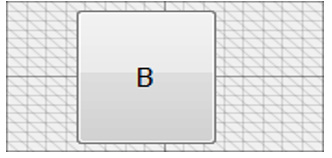
1. Add Button
The appearance of the Button element in the interface editor:
When you right-click the Button element on the page and select Properties, a window opens where you can configure its variables.
See all variables in the Properties window.
Note: The Link variable in the Properties window is different for each element. Therefore, each table is written separately per element.
Link Options:
- Value (Links to numeric values or parameters)
- Analog (Links related to analogs)
- Function (Links to functions)
- OutPort (Links to output pins)
- InPort (Links to input pins)
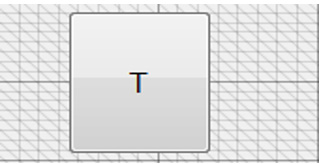
2. Add Toggle
Used for two-position commands. Toggling the button turns the corresponding function ON/OFF (e.g., to control the spindle).
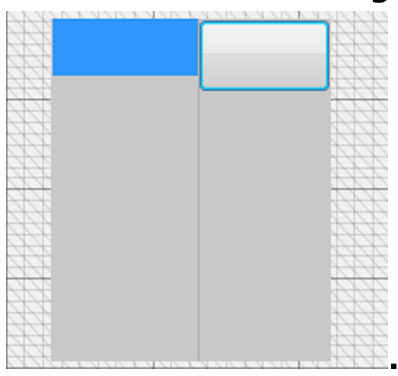
Appearance in the editor:
Right-click the Toggle element and select Properties to configure variables.
See all variables in the Properties window.
Link Options:
- Value
- Analog
- Function
- OutPort
- InPort
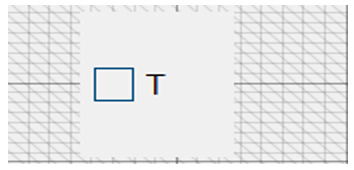
3. Add Check Box
Used for two-state commands. When checked, the output is active (e.g., vacuum control).
Appearance:
Link Options:
- Value
- Analog
- Function
- OutPort
- InPort
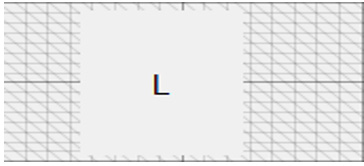
4. Add Label
Displays text, titles, or user-defined variables (e.g., feed rate).
Note: Labels only display values; they cannot be edited.
Link Options:
- Value
- Analog
- Function
- OutPort
- InPort
5. Add Value
Used to display and also modify a variable.
Link Options:
- Value
- Analog
- Function
- OutPort
- InPort
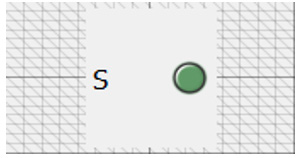
6. Add Signal
Displays boolean values (True/False) using colored indicators. Three color options available.
Link Options:
- Value
- Analog
- Function
- OutPort
- InPort
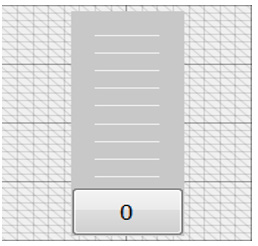
7. Add Vertical Scroll
Used to change variables, e.g., for Feed control.
Link Options:
- Value
- Analog
- Function
- OutPort
- InPort
8. Add Location
Displays coordinates of axes as Absolute (from Home) or Relative (from Reference).
Link Options:
- Value
- Analog
- Function
- OutPort
- InPort
9. Add G-Code
Displays loaded G-code lines. Executed lines are highlighted.
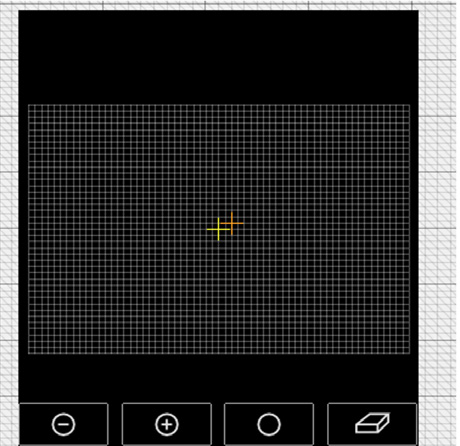
10. Add Tool Path
Shows the visual path of loaded files. During simulation or real operation, you can track tool movement.
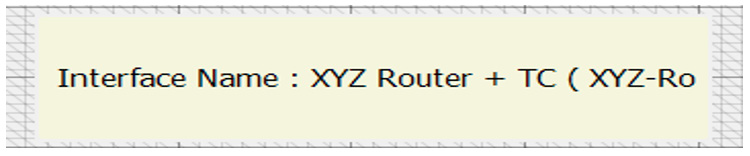
11. Add Progress Bar
Displays:
- Interface name in normal mode
- Remaining time during operation
- Errors or emergencies in red
- Opens Debug Form on double-click
- Press
CTRL+SHIFT+ALT+PrtSctwice to view performance report in Notepad
12. Add Tab
Adds a new section/tab to the interface (only in specific areas like bottom toolbar).
13. Refresh
Refreshes displayed content. Used after changes like resizing the Location element.
14. Properties
Opens the properties window to edit variables of the selected element.
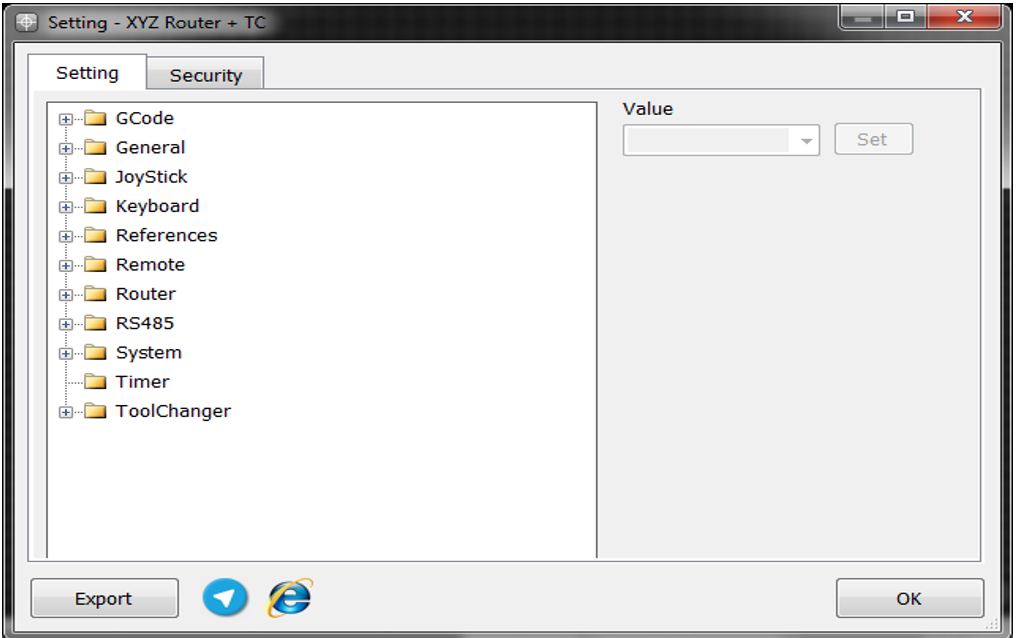
15. Main Setting
Opens a settings panel with Settings and Security tabs.
16–19. Grid Settings
Determines precision of element movement:
- Grid / 1 – Coarse
- Grid / 2 – Medium
- Grid / 4 – Fine
- Grid / 8 – Very fine


20. Minimize
Minimizes the interface editor window.
21. Exit
Exits the interface editor window.